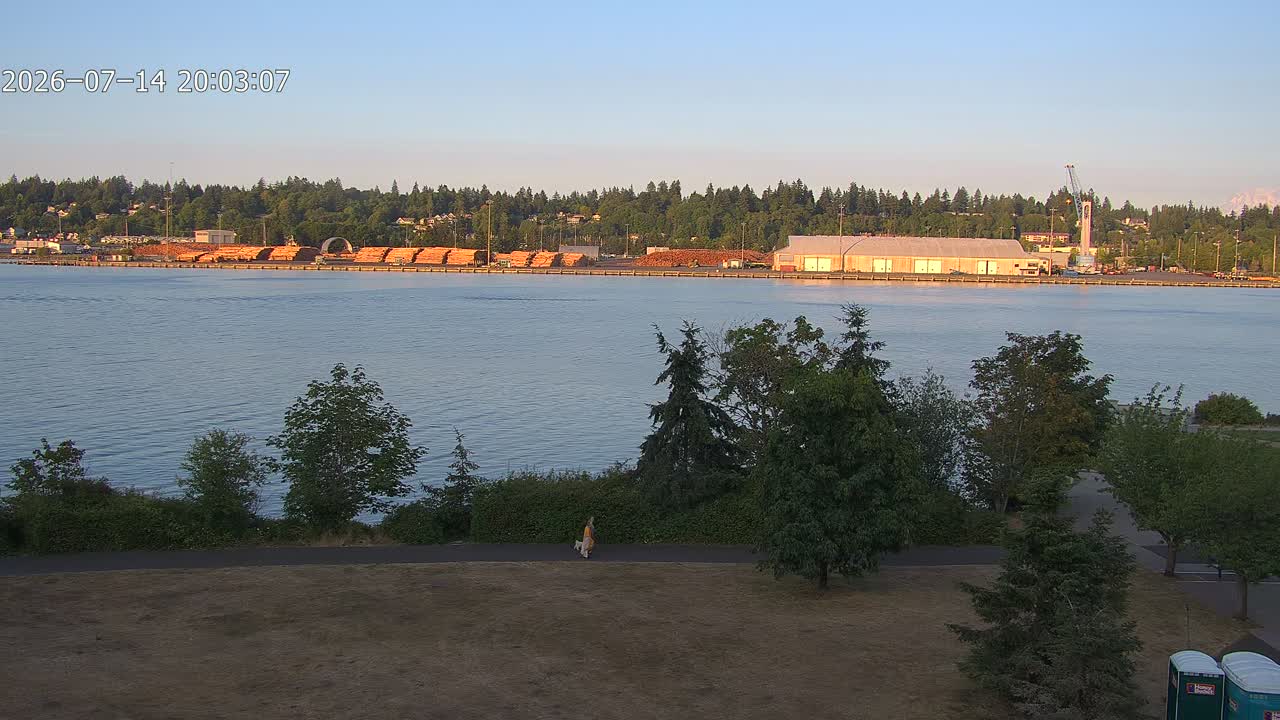
📷 West Bay 1
Loading…
This board shows the tide at the Port of Olympia two ways at once — what the water is actually doing, and what it was predicted to do — so you can see not just the tide, but how today differs from the textbook.
The large reading is the live tide height from our own sensor, updated automatically every couple of minutes. The colored arrow beside it shows which way the tide is moving right now: green up = rising (flood), red down = falling (ebb). The darker the arrow, the faster the water is moving; a faint sideways arrow means the tide is near slack (barely moving, around high or low water).
Live gauge (blue): the real tide height measured by our pressure sensor at the port. An actual measurement — not a forecast.
NOAA prediction (amber): the astronomical tide NOAA expects. It is computed from harmonic constituents — a tide “fingerprint” of dozens of cycles (the pull of the moon and sun) measured from past observations and projected forward like clockwork. It is math from history, not a live reading.
NOAA does not operate a live, real-time gauge in Olympia (Budd Inlet) — their Olympia numbers are predictions only. A prediction knows the moon and sun, but it cannot see today’s weather. Real water is pushed higher or lower by wind, barometric pressure, rainfall and river inflow, and storm surge. Our on-site gauge captures those real effects. So when the blue line sits above or below the amber line, that gap is the “weather residual” — the part of the tide the astronomy can’t predict. A big storm and a low-pressure system, for example, can raise real water well above the predicted level.
The Variance tab plots that gap by itself (live gauge minus NOAA) on the same timeline. Above zero means the real water is higher than predicted; below zero means lower. It’s the quickest way to see how strongly today’s weather is bending the tide.
The smooth “NOAA Predicted” line on this chart hides a small secret: NOAA doesn’t actually publish a curve for Olympia. It publishes only the points — the times and heights of each high and low tide.
Here’s why. Tide predictions come from harmonic analysis: the tide at any location is the sum of dozens of precise astronomical rhythms (the moon’s orbit, the sun’s pull, the tilt of each) whose strengths are measured from years of water-level records. Stations with a full set of these “harmonic constituents,” like Seattle, can generate a true predicted curve for any minute of any day. Olympia is what NOAA calls a subordinate station: it has no constituents of its own. Its predictions are made by taking Seattle’s highs and lows and applying fixed corrections — the tide arrives in Budd Inlet a little later and swings a little bigger, since our long, narrowing inlet funnels and amplifies the wave as it travels down Puget Sound. The result is four official numbers a day, and nothing in between.
Any smooth line drawn between those points — including the one on NOAA’s own website — is an approximation. Rather than connect the dots with a generic curve, this dashboard borrows the shape of Seattle’s full harmonic prediction for each rise and fall, then pins it exactly to Olympia’s official high and low values. It’s the closest thing to a real predicted curve that exists for Budd Inlet.
The blue “Observed” line is the real thing: live water level from the Port’s own tide gauge on the dock below. Where observed and predicted disagree, you’re seeing weather — wind piling water into or out of the inlet, and barometric pressure pressing the sea surface down or letting it rise. The astronomy is predictable to the minute; the atmosphere keeps things honest.
Questions or ideas about this data? Contact Afsin Yilmaz.
| Serial | Measurement | Value | Unit |
|---|---|---|---|
| Loading… | |||
| Time | Tide | ft (MLLW) |
|---|